
How to Unify the Color Scale in a COMSOL Plot Group
When you plot two results in COMSOL, the colors often do not match. Each plot picks its own color range by default. This makes it hard to compare two plots side by side. Luckily, COMSOL has a simple fix for this.
In this article, you will learn how to lock the color scale. This way, both plots use the same colors for the same values.
Why the Colors Do Not Match
By default, COMSOL sets the color range automatically for each color plot. It looks at your data and picks a minimum and a maximum value. This is called the auto range.
The auto range changes from plot to plot. Say your first Surface plot shows a temperature range of 20°C to 100°C. Your second plot shows a constant 20°C. The colors will not line up. The plot is then ... just very wrong.
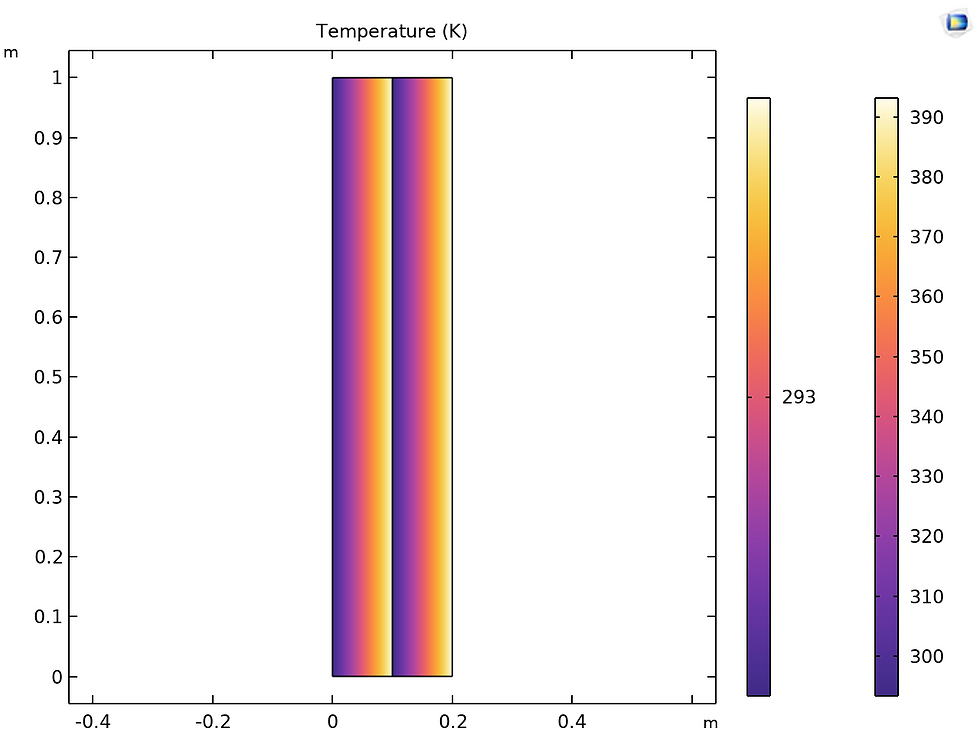
The Fix: Inherit Style
You could fix this by typing the same Minimum and Maximum into both plots by hand. But COMSOL has a built-in tool that does this for you, and keeps doing it.
Click the plot node you want to match. This is usually a Surface, Volume, Slice, or Contour node inside your Plot Group. In the Settings window, open the Inherit Style section. A Plot dropdown appears. Choose the other plot in your Plot Group, the one whose colors you want to copy.
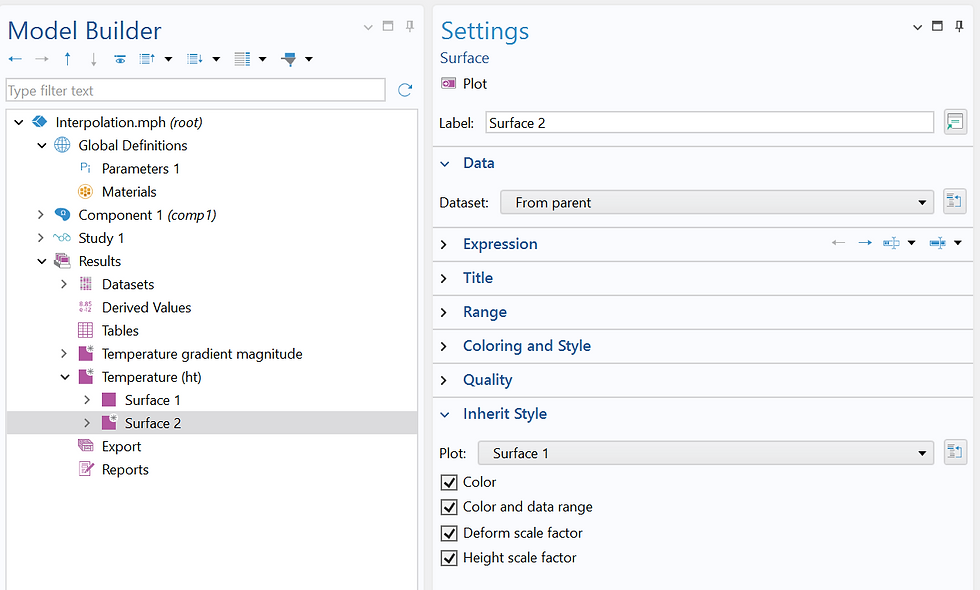
Below it, you will see checkboxes for what to copy. Make sure Color and data range are checked. Click Plot. Both plots now use the same color scale.
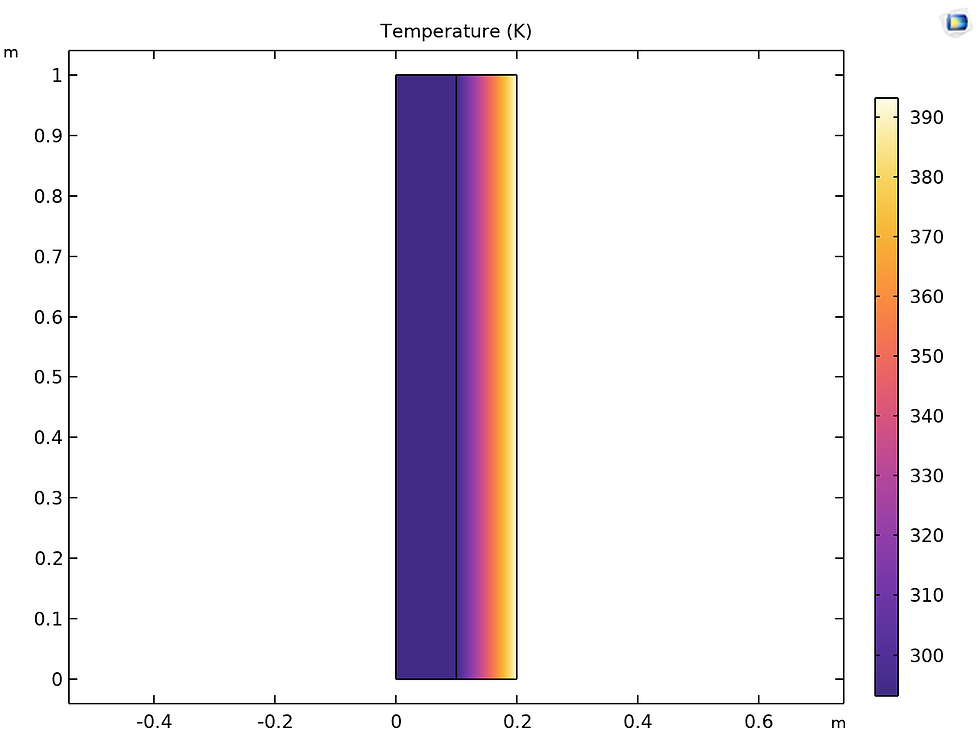
The best part: this link stays active. If you change the source plot later, the plot that inherits its style updates automatically.
If Your Plots Are in Different Plot Groups
Inherit Style needs the plot to be inside the same Plot Group. If you are comparing two separate Plot Groups instead, for example, a "before" and an "after" view, you will still need Manual color range instead.
Where This Trick Helps
The most common cases where this is useful:
Comparing two time steps of a transient study.
Comparing two Plot Groups side by side, for example, before and after a design change.
Composing a plot with multiple surfaces
Need Help Making Your COMSOL Results Look Sharp?
Building the model is only half the job - clear, well-matched plots make your results easy to trust and easy to present. If you want a hand setting up your COMSOL model, cleaning up your plots, or getting a report ready to share, reach out to Simulation Guys. We help you turn raw simulation data into results people can actually understand.
